December 2022 Saint Cloud Weather Summary
|
Top of Page
(December 2022 Summary) |
||
|
|
||
|
2022 Drought in Southern and West Central Minnesota
|
Severe Weather |
Other Weather Notables
|
Top 5 Wet, White December Offsets Some of Dry Late Summer
December 2022 St. Cloud Weather Summary (Annual 2022 Summary Below)
December Has Been White....
After a warm season and fall that was badly short of water in parts of Minnesota, the cold season of wet and white continued in December. At St. Cloud State University, the official St. Cloud snow measurement site, there were 22.5 inches of snow, 13.3 inches above average. This made December 2022 the 5th snowiest December (22.5 inches) in St. Cloud records. It was the snowiest December in St. Cloud since 2008 (23.0 inches). The snowiest December in St. Cloud records was 25.5 inches in 1927. It was the snowiest of any month since February 2019 (27.6 inches) and ranks as the 17th snowiest of any month in St. Cloud snow records, which date back to 1903. The snowiest month in St. Cloud history was the 51.7 inches in March 1965.
The Minneapolis-St. Paul International Airport had 19.8 inches in December, the 10th snowiest December there, and Duluth had 44.9 inches in December, their snowiest December ever.
With Much of It Coming in Two Big Doses
In St. Cloud, there were 11 days with measurable snowfall, but two main storms, on December 13-17 (12.4 inches in St. Cloud, the 19th largest St. Cloud single storm snowfall), and on December 21-24 (5.0 inches in St. Cloud), produced the most snowfall. These two major storms each produced a St. Cloud daily record daily snowfall on December 15 (7.2 inches) and December 21 (3.8 inches). The storms were also quite disruptive, with the December 13-17 storm producing a mixed bag of precipitation, meaning that the wet snow was especially heavy to remove. The December 21-24 storm had a bit of snow, but once the snow ended, strong winds and severe wind chills (wind chills frequently in the -30s and -40s) made traveling hazardous with many roads from the Minnesota River Valley and southern Minnesota through the Dakotas closed during the run-up to Christmas.
In the wake of the December snows, most of the northern half of Minnesota has at least 10 inches of snow on the ground and that's in advance of an early January 2023 storm.
The frozen precipitation will limit the drought relief, since it fell on top of frozen ground. When the snow melts, it will help bring lake levels and river and stream flow closer to average. However, it won't help ground water conditions much, since all of the meltwater will directly run into rivers and lakes.
December Has Been Wet....
The snow contained a large amount of water within it. The St. Cloud Municipal Airport December precipitation totaled 1.90 inch, 1.02 inch above average. It was the the 5th wettest December in St. Cloud records, but it was 0.13 short of last December (2.01 inches; 3rd wettest). Duluth (6th wettest December) ended up with 3.27 inches of precipitation (more than double the average of 1.47 inch, and Minneapolis-St. Paul International Airport had 1.82 inches, 0.65 inch above average. Most of Minnesota picked up at least an inch of precipitation in December (green on the NWS Minnesota December liquid precipitation map) with portions of the Twin Cities and southwestern Minnesota picking up over 2 inches (yellow), and the North Shore and the Iron Range with between 3 and 5 inches, the most on the hills overlooking Lake Superior. This, along with the above average November precipitation in eastern Minnesota, has allowed substantial relief from the dry conditions during the summer and fall. Note that most of the red, the worst drought levels, has disappeared (see the comparison between November 1 vs December 27 on the two map comparison of the US Drought Monitor).
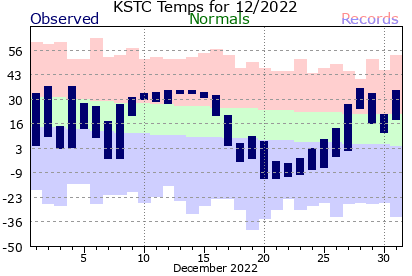
Temperatures Had Both Extremes
The winter has been widely forecast as a colder than average winter, but it was never more Jekyll and Hyde than during December. St. Cloud had within December
- three straight days remaining below zero (average for the entire season is 4.3 days)
- 11 days with a low of zero or colder (9 in a row Dec 18-26). (average for the entire season is 42.7 days)
- 8 straight days with a mean temperature at least 10 degrees colder than average (10 for the month total)
- BUT 7 straight days (10 overall) with a mean temperature at least 10 degrees WARMER than average (Dec 10-16)
The net result during a month was a St. Cloud December temperature of 15.8 degrees, 2.0 degrees below average. One reason for the temperature extremes was the build-up of true arctic air from the Arctic Ocean into northern Canada during the first two weeks of December, then the development of an intense arctic high in the Yukon, which slid into the US after the major pre-Christmas storm moved into eastern Canada. That got rid of the slab of really cold air and no other piece has developed in northern Canada or even Siberia since then.
St. Cloud Stands Out from Dry Conditions in Much of Minnesota During 2022
Annual 2022 St. Cloud Weather Summary
The number one weather-related issue in Minnesota 2022, as rated by a panel of meteorologists contacted through the Minnesota Department of Natural Resources, was the severe rain shortfall in much of central and southern Minnesota. Portions of the Minnesota River Valley and southern Minnesota were as much as 12-13 inches behind average in rainfall (see Contrast Across Central Minnesota April-October in my October 2022 weather summary). However, St. Cloud ended up the year nearly 4 inches ahead on rainfall. Note the difference in the 2022 running precipitation total for Minneapolis-St. Paul Airport compared to St. Cloud. There is a nine-and-a-half inch difference in the rainfall, with MSP well below average (in the tan) and St. Cloud nearly 4 inches in the green.
Why St. Cloud Was Wet, While Other Areas Were Dry
The St. Cloud Regional Airport ended up with 32.43 inches of rain, 3.94 inches above average. This was the 26th wettest year of the 130 years in St. Cloud records. The main reason for the difference was that St. Cloud and areas just north and northeast were hit hard by May and June storms that missed many areas further to the south. St. Cloud was affected by a series of thunderstorms on May 9, May 11 and May 12. The rainfall on those three days was 6.60 inches, including 3.63 inches in 24 hours on May 11 and 12. Some of those storms also produced large hail in the area. This was just part of a series of storms that hit different parts of Minnesota during the month of May, likely producing the most active severe weather May since the 1990's. May ended up being St. Cloud's 5th wettest.
Then, in June, a series of thunderstorms also developed with one particular set of storms flaring near the Mississippi River in southern Morrison County then slowly moving southeastward into St. Cloud. There was a total of 4.28 inches at the St. Cloud Airport, 3.83 inches of which fell in 6 hours. That was the 11th highest single storm rainfall in St. Cloud records. The May 11-12 rainfall ranked 13th. Other areas had far less rainfall than the twelve and three-quarter inches in May and June combined.
Drier Fall Didn't Overcome May, June Dousings
St. Cloud spent the rest of the summer with near average rain, but was much drier in September and October. October was one of Minnesota's all-time driest Octobers. St. Cloud had its 7th driest October, driest since 1974. Overall during the growing season:
- September-October "dry period" 2.54 inches (3.08 below average)
- April-August wet period: 23.00 inches (5.00 above average)
In all, St. Cloud had 121 days with measurable precipitation, tying for 14th place for the most days with measurable precipitation (121).
December Snow Breaks Nearly Two Years Without a Five-Inch Storm
During the calendar year, which straddled two snow seasons, St. Cloud picked up 57.3 inches of snow, 9.4 inches above average. The December 13-17 storm not only ranked as one of the few storms producing at least a foot of snow in St. Cloud but also produced the first daily snowfall of at least 5 inches since 2022. Early in the snow season, St. Cloud had a snowfall of 7.0 inches on October 20, 2020, and 7.2 inches on November 10, 2020, but no large snows the rest of the 2020-2021 season (45.2 inches for that season) nor during the 2021-2022 season (actually 49.5 inches, a bit above average).
St. Cloud wasn't the only area to get incredible rainfall. Late season snow and April rain (see northern Minnesota heavy rainfall), plus the rapid snowmelt, led to unprecedented flooding along Rainy Lake and the Rainy River (see Rainy River flooding).
The severe weather in May was capped by a number of tornadoes over Memorial Day weekend. Other severe weather hit several parts of Minnesota in June, including a swath producing widespread wind damage on June 20-21.
Temperatures Highs and Lows, Ending Up Near Average
Temperature-wise, St. Cloud had some ups and downs with a cold winter of 2021-2022, an extremely Gloomy and Wet April, then some intense warm periods in late May, parts of June (see intense heat at times of June 2022), a brief outbreak of extreme heat and humidity August 2, and a lot of up and down in the fall and early winter. The overall picture? St. Cloud's 2022 average temperature was 42.6 degrees, just 0.3 degrees colder than average.
First 100-Degree High Since 2011
St. Cloud's heat wasn't quite as intense or persistent as other nearby central Minnesota cities. St. Cloud only had 7 days with a high of 90 degrees or warmer, 4.4 days below the average, while the Twin Cities had 18 days and Redwood Falls had 23 days, including 3 with a high of at least 100. Still, the June heat wave was remarkable, producing a high of 101 on June 20 (first 100+ high since June 7, 2011, 60th 100-degree day on record). The streak also produced 2 days with a high of at least 97 degrees. There have only been 4 days that warm between 2007 and 2021. And, the 101 high was one of only three daily record warm highs set or tied in 2022. There were also 2 record warm lows broken or tied, both of which were at least 70 degrees.
|
Top of Page
(December 2022 Summary) |
||
|
|
||
|
2022 Drought in Southern and West Central Minnesota
|
Severe Weather |
Other Weather Notables
|
|
Temperatures (°F)
|
December 2022
|
Normal
|
|
| December Average High Temperature (°F) |
22.6
|
25.8
|
|
| December Average Low Temperature (°F) |
8.9
|
9.8
|
|
| Mean Temperature for December (°F) |
15.8
|
17.8
|
|
|
December Extremes |
Temperature(°F)
|
Date
|
|
| Warmest High Temperature for December 2022 (°F) |
37
|
December 2, 4
|
|
| Coldest High Temperature for December 2022 (°F) |
-5
|
December 22
|
|
| Warmest Low Temperature for December 2022 (°F) |
33
|
December 13, 14
|
|
| Coldest Low Temperature for December 2022 (°F) |
-13
|
December 20, 21
|
|
|
Record Temperatures in December 2022
|
Temperature(°F)
|
Date
|
Old Record
|
| No record temperatures set | |||
|
Temperature Thresholds
|
Number of Days
|
Normal
|
|
| December 2022 Days with High Temperatures <= 32°F |
19
|
23.5
|
|
| December 2022 Days with High Temperatures <= 0°F |
3
|
1.0
|
|
| December 2022 Days with Low Temperatures <= 32°F |
29
|
25.7
|
|
| December 2022 Days with Low Temperatures <= 0°F |
11
|
9.9
|
|
| December 2022 Days with Low Temperatures <= -20°F |
0
|
0.9
|
|
|
Melted Precipitation (in)
|
December 2022
|
Normal
|
|
|
December 2022 Melted Precipitation (in)
|
1.90 (5th wettest December)
|
0.88
|
|
|
Precipitation Thresholds
|
Number of Days
|
Normal
|
|
| December 2022 Days with Measurable (>= 0.01 inch) Precipitation |
11
|
6.6
|
|
| December 2022 Days with >= 0.10 inch Precipitation |
5
|
2.0
|
|
| December 2022 Days with >= 0.25 inch Precipitation |
4
|
0.7
|
|
| December 2022 Days with >= 0.50 inch Precipitation |
1
|
0.1
|
|
| December 2022 Days with >= 1.00 inch Precipitation |
0
|
0.0
|
|
|
December Extremes
|
Precipitation (in)
|
Date
|
|
|
Most Daily Precipitation in December 2022
|
0.50
|
December 15
|
|
|
Record Precipitation in December 2022
|
Precipitation (in)
|
Date
|
Old Record
|
| Daily Record Precipitation |
0.31 inch
|
December 21
|
0.21 inch in 1951
|
|
Snowfall (in)
|
December 2022
|
Normal
|
|
|
December 2022 Saint Cloud Airport Snowfall (in)
|
22.5 (5th snowiest December)
|
9.3
|
|
| 2022-2023 Seasonal Snowfall (1 Oct 2022 - 31 Dec 2022) |
27.7
|
20.1
|
|
|
Snowfall Thresholds
|
Number of Days
|
Normal
|
|
| December 2022 Days with Measurable (>= 0.1 inch) Snowfall |
11
|
8.3
|
|
| December 2022 Days with >= 1.0 inch Snowfall |
7
|
3.2
|
|
| December 2022 Days with >= 2.0 inch Snowfall |
4
|
1.6
|
|
| December 2022 Days with >= 5.0 inch Snowfall |
1
|
0.2
|
|
|
December Extremes
|
Snowfall (in)
|
Date
|
|
|
Most Daily Snowfall in December 2022
|
7.2 (set daily record; see below)
|
December 15
|
|
|
Record Snowfall in December 2022
|
Snowfall (in)
|
Date
|
Old Record
|
| Daily Record Snowfall |
7.2 inch
|
December 15
|
5.0 inches in 1902
|
|
3.8 inch
|
December 21
|
2.8 inches in 1993
|
|
|
Top of Page
(December 2022 Summary) |
||
|
|
||
|
2022 Drought in Southern and West Central Minnesota
|
Severe Weather |
Other Weather Notables
|
|
Temperatures (°F)
|
2022
|
Average
|
| Average High Temperature (°F) |
52.8
|
53.1
|
| Average Low Temperature (°F) |
32.3
|
32.7
|
| Mean Temperature for 2022 (°F) |
42.6
|
42.9
|
| 2022 Temperature Thresholds |
2022
|
Average
|
| Warm Season | ||
| 2022 Days with High Temperatures >= 90°F |
7
|
11.4
|
| 2022 Days with High Temperature >= 100°F |
1
|
0.5
|
| 2022 Days with Low Temperatures >= 70°F |
4
|
3.0
|
| 2022 Days with Low Temperatures >= 75°F |
0
|
0.47
|
| Growing Season (Consecutive Days with Low Temp>= 32°F) Apr 29-Sept 27 |
152
|
137
|
| Cold Season | ||
| 2022 Days with High Temperatures <= 32°F |
88
|
87.3
|
| 2022 Days with High Temperatures <= 0°F |
6
|
4.3
|
| 2022 Days with Low Temperatures <= 32°F |
172
|
170.4
|
| 2022 Days with Low Temperatures <= 0°F |
52
|
42.6
|
| 2022 Days with Low Temperatures <= -20°F |
5
|
5.4
|
|
Liquid Equivalent Precipitation (in)
|
2022
|
1991-2020 Average
|
|
2022 Total Precipitation (in)
|
32.43
|
27.71
|
| Wettest/Driest Years in St. Cloud Records | ||
| Precipitation Thresholds |
2022
|
1896-2022 Average
|
| 2022 Days with Measurable (>= 0.01 inch) Precipitation |
121
|
97.3
|
| 2022 Days with >= 0.10 inch Precipitation |
57
|
52.9
|
| 2022 Days with >= 0.25 inch Precipitation |
36
|
32.1
|
| 2022 Days with >= 0.50 inch Precipitation |
22
|
16.8
|
| 2022 Days with >= 1.00 inch Precipitation |
7
|
5.5
|
|
Snowfall (in)
|
2022
|
1991-2020 Average
|
|
2022 Total Snowfall
|
57.3 (25th snowiest out of 122 years)
|
47.9
|
| Precipitation Thresholds |
2022
|
1904-2022 Average
|
| 2022 Total Days with Measurable (>= 0.1 inch) Snowfall |
46
|
32.2
|
| 2022 Total Days with >= 1.0 inch Snowfall |
27
|
14.0
|
| 2022 Total Days with >= 2.0 inch Snowfall |
11
|
7.6
|
| 2022 Total Days with >= 5.0 inch Snowfall |
1
|
1.4
|
|
Temperature (°F)
|
Jan | Feb | Mar | Apr | May | Jun | Jul |
| Average High Temperature | 18.5 | 21.6 | 37.5 | 47.4 | 66.3 | 81.6 | 82.5 |
| Average Low Temperature | -5.1 | -1.9 | 20.2 | 31.2 | 45.6 | 57.0 | 60.6 |
| Mean Temperature | 6.7 | 9.8 | 28.8 | 39.3 | 56.0 | 69.3 | 71.6 |
| Departure from Normal | -5.1 | -6.8 | -0.4 | -4.0 | -0.5 | +3.3 | +1.3 |
| 2020 Warmest High Temperature |
101 on June 20 (first 100+ high since June 7, 2011, 60th 100-degree day on record) |
||||||
| 2020 Coldest High Temperature | -7 on January 1 | ||||||
| 2020 Warmest Low Temperature | 72 on July 19 | ||||||
| 2020 Coldest Low Temperature | -28 on January 7 | ||||||
| 2022 Daily Record Temperatures |
Temperature (°F)
|
Date
|
|||||
| Record Warm High Temperature (2 broken, 1 tied) |
95 (tie)
|
June 14
|
|||||
|
101
|
June 20
|
||||||
|
75
|
November 2
|
||||||
| Record Warm Average Temperature (1 broken, 1 tied) |
83
|
June 14
|
|||||
|
85 (tie)
|
June 19
|
||||||
|
86
|
June 20
|
||||||
| Record Warm Low Temperature (1 broken, 1 tied) |
70
|
June 14
|
|||||
|
71 (tie)
|
June 19
|
||||||
| Record Cold High Temperature |
None Broken
|
||||||
| Record Cold Average Temperature (4 broken, 1 tied) |
None Broken
|
||||||
| Record Cold Low Temperature (3 tied) |
None Broken
|
||||||
|
Precipitation (in)
|
Jan | Feb | Mar | Apr | May | Jun | Jul |
| Liquid Precipitation | 0.58 | 0.78 | 1.52 | 3.55 | 7.32 (5th wettest) | 5.44 | 2.20 |
| Departure from Normal | -0.09 | -0.02 | -0.05 | +0.94 | +3.66 | +1.69 | -1.40 |
| Most in 24 hours | 3.03 on June 24 | ||||||
|
New Daily Precipitation Records Set
|
Amount (inches)
|
Date
|
|||||
|
Daily Record Precipitation (3 broken)
|
2.03
|
May 12
|
|||||
|
3.03
|
June 24
|
||||||
|
0.31
|
December 21
|
||||||
|
Snowfall (in)
|
Jan | Feb | Mar | Apr | May | Jun | Jul |
| Snowfall | 10.8 | 9.7 | 6.3 | 1.9 | 0.0 | 0.0 | 0.0 |
| Departure from Normal | +2.0 | +2.6 | -1.8 | -1.0 | - | - | - |
| Most in 24 hours | 7.2 inches on December 15 | ||||||
|
New Snowfall Records Set
|
Amount (inches)
|
Date
|
|||||
|
Daily Record Snowfall (3 broken)
|
1.5
|
November 14
|
|||||
|
7.2
|
December 15
|
||||||
|
3.8
|
December 21
|
||||||
|
Top of Page
(December 2022 Summary) |
||
|
|
||
|
2022 Drought in Southern and West Central Minnesota
|
Severe Weather |
Other Weather Notables
|
|
Temperature (°F)
|
Aug | Sept | Oct | Nov | Dec | 2022 |
| Average High Temperature | 79.9 | 73.8 | 60.5 | 39.5 | 22.6 | 52.8 |
| Average Low Temperature | 57.6 | 50.2 | 36.4 | 24.0 | 8.9 | 32.3 |
| Mean Temperature | 68.8 | 62.0 | 48.5 | 31.8 | 15.8 | 42.6 |
| Departure from Normal | +1.1 | +2.5 | +2.8 | +0.9 | -2.0 | -0.3 |
|
|
||||||
|
Precipitation (in)
|
Aug | Sept | Oct | Nov | Dec | 2022 |
| Liquid Precipitation | 4.49 | 2.23 | 0.31 (7th driest) | 2.11 | 1.90 (5th wettest) | 32.43 (26th wettest of 130) |
| Departure from Normal | +0.49 | -0.78 | -2.30 | +0.74 | +1.02 | +3.94 |
|
Snowfall (in)
|
Aug | Sept | Oct | Nov | Dec | 2022 |
| Snowfall | 0.0 | 0.0 | 0.2 | 5.0 | 22.5 (5th snowiest) | 44.8(4th highest) |
| Departure from Normal | - | - | -0.5.9 | -4.9.9 | +13.2 | +2.8 |
|
Top of Page
(December 2022 Summary) |
||
|
|
||
|
2022 Drought in Southern and West Central Minnesota
|
Severe Weather |
Other Weather Notables
|
|
Year
|
Hottest High (°F)
|
Date
|
Days with High >= 97°F
|
|
1988
|
102°F
|
June 24, July 31
|
13
(7 days with >= 100°F) |
|
1989
|
98°F
|
August 4
|
1
|
|
1990
|
101°F
|
July 3
|
1
|
|
1991
|
95°F
|
July 18
|
0
|
|
1992
|
92°F
|
June 12, August 9
|
0
|
|
1993
|
90°F
|
August 10
|
0
|
|
1994
|
95°F
|
June 14
|
0
|
|
1995
|
97°F
|
June 17, July 13
|
2
|
|
1996
|
96°F
|
June 28
|
0
|
|
1997
|
95°F
|
June 23
|
0
|
|
1998
|
94°F
|
May 18
|
0
|
|
1999
|
98°F
|
July 30
|
2
|
|
2000
|
94°F
|
June 9
|
0
|
|
2001
|
98°F
|
August 6, 7
|
4
|
|
2002
|
95°F
|
June 30, July 6
|
0
|
|
2003
|
96°F
|
August 24
|
0
|
|
2004
|
96°F
|
June 30
|
0
|
|
2005
|
98°F
|
June 23
|
1
|
|
2006
|
101°F
|
July 31
|
5
|
|
2007
|
96°F
|
August 10
|
0
|
|
2008
|
91°F
|
June 6, 11, August 18
|
0
|
|
2009
|
92°F
|
May 20
|
0
|
|
2010
|
94°F
|
May 24
|
0
|
|
2011
|
101°F
|
June 7
|
1
|
|
2012
|
94°F
|
May 18
|
0
|
|
2013
|
95°F
|
May 14, Aug 26
|
0
|
|
2014
|
94°F
|
July 21
|
0
|
|
2015
|
91°F
|
August 14
|
0
|
|
2016
|
93°F
|
June 25, July 22
|
0
|
|
2017
|
92°F
|
June 10, July 17
|
0
|
|
2018
|
97°F
|
June 29
|
1
|
|
2019
|
92°F
|
July 15
|
0
|
|
2020
|
96°F
|
June 8
|
0
|
|
2021
|
98°F
|
June 5
|
2
|
|
2022
|
101°F
|
June 14
|
2
|
|
Top of Page
(December 2022 Summary) |
||
|
|
||
|
2022 Drought in Southern and West Central Minnesota
|
Severe Weather |
Other Weather Notables
|


Send comments to: raweisman@stcloudstate.edu