October 2022 Saint Cloud Weather Summary
Dry Funk Spreads to the Rest of Minnesota
Saint Cloud October 2022 Weather Summary
The main warm-season weather story in Minnesota has been the dry conditions from early summer through the fall in much of southern and western Minnesota, including the Twin Cities. In October, the dryness intensified and spread nearly statewide. Most of the state had less than an inch of rain with a good chunk of Minnesota (blue) picking up less than half inch of rain. In St. Cloud, it was the 7th driest October on record of the 131 years on record with only 0.31 inches. It was the driest October since 1974.
In the Twin Cities, it was even worse with only 0.24 inch of rain, the 6th driest October For September and October combined, Minneapolis-St. Paul had its second driest period with less than half an inch (0.48 inch). Only 1952 had less combined September and October rainfall.
The worst of the precipitation shortfall continued to be in the Twin Cities, the Minnesota River Valley, and a good chunk of western Minnesota, which primarily missed the heavy spring and early summer rainfall that hit northern Minnesota and central Minnesota from St. Cloud northward. In the table below, Redwood Falls and Minneapolis-St. Paul International Airport are more than 10 inches behind on rain for the growing season (since April 1).
Redwood Falls did even worse, with a mere 0.03 inch of rainfall.
| Warm Season Statistics Comparison | ||
| Rainfall Deficits |
October Rainfall (in) (difference from avg) |
April-October Rainfall (in) (difference from avg) |
| Brainerd | 0.49 (-1.88) | 20.21 (-1.27) |
| St. Cloud | 0.31 (-2.30) | 25.54 (+2.30) |
| Minneapolis-St. Paul Int'l Airport | 0.24 (-2.34) | 14.29 (-11.14) |
| Redwood Falls | 0.05 (-2.16) | 9.69 (-12.69) |
Meanwhile, Brainerd is about an inch and a quarter behind since the start of April and St. Cloud is still more than two and a quarter inches above average, but that's well down from the April-August total, which was over five and a half inches above average (see table below under precipitation).
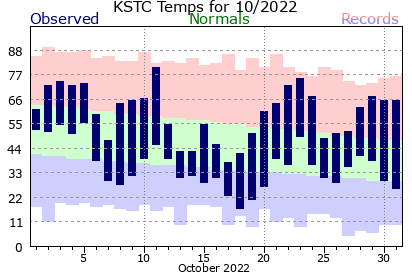
In addition, the mainly warmer than average weather continued in much of October. The St. Cloud Regional Airport finished with a 48.5 degree October temperature, 2.8 degrees warmer than average. That was more than two and half degrees cooler than last October, which was the 11th warmest in St. Cloud records. October 2022 only ranked 41st warmest.
There were still some bouts of roller coaster temperatures with warm weather during the first 5 days of the month, the 20th through the 24th, and the last 4 days of the month. There was a week of quite cold temperatures from the 12th through the 19th. This included the first widespread measurable snowfall in Minnesota October 14. Much of northern and central Minnesota picked up between a few tenths and a couple of inches, although St. Cloud had one of the lowest totals with 0.2 inch (a dusting).
The prolonged dryness led to some extreme temperature ranges just in a single day. Even when warm air moved in, the air was either heated by its trip down the US or the Canadian Rockies, so it was quite dry. The dry conditions allows the bigger extremes between high and low since water vapor is the most common greenhouse gas in the atmosphere. With less of it in the air, more sunshine gets through to the ground to be absorbed, allowing warmer highs, but more of the earth's energy at night goes straight out to space, allowing colder lows. There were 9 days with at least a 30-degree spread between high and low temperature, 3 days with a 35-degree spread (the 11th, which had the warmest high of the month, the 30th, and the 31st). The last day of October set the mark with a 40-degree spread between the high and low with a hard freeze in the morning and a 66-degree high in the afternoon.
Note: the above paragraph does not contradict the theory that increasing human-produced carbon dioxide is producing global warming. While there is less carbon dioxide in the air than water vapor, it still plays a role in heating the earth and its increase has been associated with warmer global average temperatures throughout Earth's history.
The US Drought Monitor shows that the dry conditions that have been the worst in the Minnesota River Valley, the Twin Cities, and southwestern Minnesota have dominated much of the Plains and parts of the West. The red and dark areas are where the serious long-term droughts are taking place, which rival some of the worst droughts seen in Minnesota, like in 1988. More precipitation would help, but it needs to hurry, before the ground freezes, forcing most of the melt water to run off into rivers and lakes. They need help, too, but it isn't as useful for plants and crops.
|
Temperatures (°F)
|
October 2022
|
Normal
|
|
| Average High Temperature (°F) |
60.5
|
55.9
|
|
| Average Low Temperature (°F) |
36.4
|
35.5
|
|
| Mean Temperatures for October (°F) |
48.5
|
45.7
|
|
|
Temperature Thresholds
|
Number of Days
|
Normal
|
|
| October 2022 Days with High Temperature of 32°F or lower |
0
|
0.4
|
|
| October 2022 Days with Low Temperature of 32°F or lower |
7
|
11.0
|
|
|
October Temperature Extremes
|
Temperature(°F)
|
Date
|
|
| Warmest High Temperature for October 2022 (°F) |
81
|
October 11
|
|
| Coldest High Temperature for October 2022 (°F) |
38
|
October 17
|
|
| Warmest Low Temperature for October 2022 (°F) |
53
|
October 1
|
|
| Coldest Low Temperature for October 2022 (°F) |
17
|
October 18
|
|
|
Record Temperatures in October 2022
|
Temperature(°F)
|
Date
|
Old Record
|
| No record temperatures set | |||
|
This Year
|
Normal
|
||
|
October 2022 Precipitation (in)
|
0.31&
|
2.61
|
|
| 2022 "Dry Fall Period" (September 1-October 31) |
2.54 (-3.08 from average)
|
5.62
|
|
| 2022 Sopping Spring-Early Summer (April 1-August 31) |
23.00 (+5.38 from average)
|
17.62
|
|
| Growing Season (April-October) 2022 Precipitation (in) |
25.54 (+2.70 from average)
|
23.24
|
|
|
2022 Total Precipitation (in)
|
28.42 (+2.18 from average)
|
26.24
|
|
| &7th Driest October; driest since 1974 | |||
|
Precipitation Thresholds
|
Number of Days
|
Normal
|
|
| October 2022 Days with Measurable (>= 0.01 inch) Precipitation |
7
|
7.4
|
|
| October 2022 Days with >= 0.10 inch Precipitation |
1
|
4.1
|
|
| October 2022 Days with >= 0.25 inch Precipitation |
0
|
2.5
|
|
| October 2022 Days with >= 0.50 inch Precipitation |
0
|
1.2
|
|
| October 2022 Days with >= 1.00 inch Precipitation |
0
|
0.4
|
|
|
October Precipitation Extremes
|
Precipitation (in)
|
Date
|
|
|
Most Daily Precipitation in October 2022
|
0.10 inch |
October 12
|
|
| Precipitation Records Set | Amount | Date | Old Record |
| No records set | |||
|
Snowfall (in)
|
This Year
|
Normal
|
|
|
October 2022 Snowfall (in)
|
0.2
|
0.7
|
|
|
October Snowfall Extremes
|
Snowfall (in)
|
Date
|
|
|
Most Daily Snowfall in October 2022
|
0.2
|
October 14
|
|
Last Update: 2 November 2022


Send comments to: raweisman@stcloudstate.edu