March 2023 Saint Cloud Weather Summary
| Year-to-Date Graph | Return to Daily Statistics by Month Table |
2023 March St. Cloud, MN Weather Summary
St. Cloud's Fourth Snowiest March, Third Snowiest Cold Season
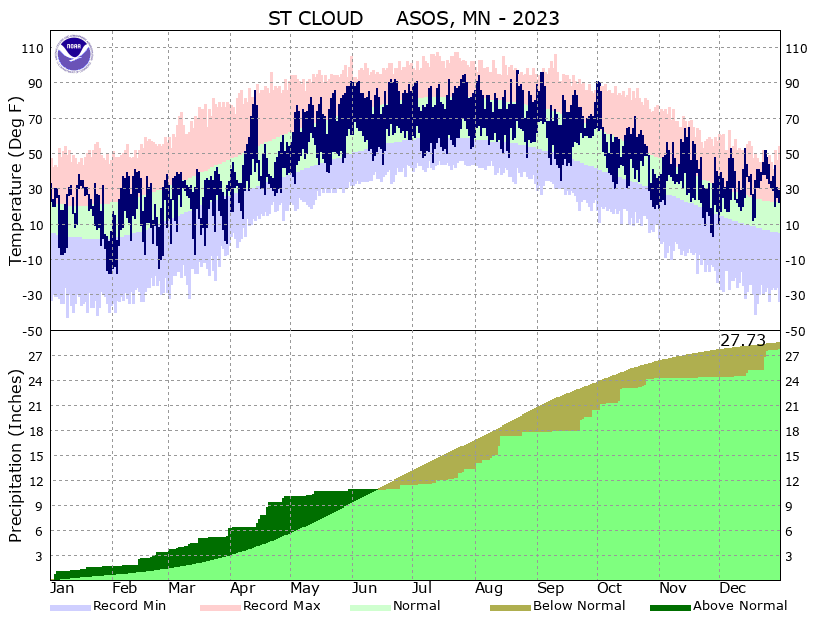
March 2023 in most of Minnesota continued the remarkable snow totals for the cold season, which have approached or even topped the 5 snowiest cold seasons at several Minnesota observing stations. In St. Cloud, 23.5 inches of snow fell in March, the 4th snowiest March in station history. The average March snowfall is 8.9 inches. For the entire cold season through April 2, St. Cloud has 84.0 inches, the 3rd snowiest season on record. This cold season is only half an inch short of second place, 1936-1937. Four more inches would top the 1964-1965 season as the snowiest on record. That 1964-1965 season had the snowiest month on record, March 1965 with 51.7 inches of snow.
Duluth stands at the 5th snowiest season on record with 128.2 inches. Minneapolis-St. Paul International Airport has 89.7 inches of snow this season, 3rd place among the snowiest seasons. Brainerd has 75.2 inches, enough for 5th place.
March marked the third of the past 4 months which were among the top 10 in snowfall. December (5th), January (10th), and now March have cracked the top 10. Also, the meteorological winter (Dec 1-Feb 28) ended up tied for 1st. Note that neither the meteorological winter nor the astronomic winter (December solstice to March equinox) should ever be taken as the entire snow season in Minnesota, where all of November through March are usually snow months, and sometimes October and April chime in as well.
On top of that, the snow has come frequently. St. Cloud has now had a record number of days (16) with at least 2 inches of snow, had the secondmost days with at least 5 inches of snow, and is one short of the record for number of days (24) with at least 1 inch of snow. The 5-inch level came after nearly 2 years without a 5-inch snowfall (since November 10, 2020). There have been two snowstorms that have ranked among St. Cloud's 20 snowiest storms. On the other hand, last snow season had 47 days with measurable snowfall, despite having only 49.5 inches of seasonal snowfall.
| Saint Cloud Cold Season Snow Statistics 2022-2023 | |||
| Statistic | 2022-2023 | Rank | Average |
| Total Snowfall (in) | 84.0 through April 2 | 3rd most | 43.0 |
| Days With Snow Cover (at least 1 inch) | 108 | 101 | |
| November Snowfall (in) | 5.0 | 6.9 | |
| December Snowfall (in) | 22.5 | 5th most | 9.3 |
| January Snowfall (in) | 18.6 | 10th most | 8.8 |
| February Snowfall (in) | 14.0 | 8.9 | |
| Winter (1 Dec-28 Feb) Snowfall (in) | 55.1 | tied for 1st with 1968-1969 | 27.0 |
| March Snowfall (in) | 22.7 | 5th most | 8.2 |
| Consecutive Days with Snow Cover (at least 1 inch) |
114 (12/8-3/31) |
86 | |
| Days with Measurable Snowfall | 43 | 22nd | 32 |
| Days with >= 1.0 inch snow | 23 | tied for 5th; one short of record from 1935-1936, 1940-1941, 1996-1997, 2010-2011 | 14 |
| Days with >= 2.0 inches snow | 16 | record; old record 15 in 1950-1951 | 7.6 |
| Days with >= 5.0 inches snow | 5 | tied for second; 9 in 1936-1937 | 1.4 |
All of that snow contained a lot of liquid. The St. Cloud March melted precipitation was 2.87 inches, 1.30 inches above average and the 11th wettest March of 131 Marches on record. It would have required another 0.14 inch to place in the Top 10. Most of the eastern half of Minnesota had at least 2 inches of precipitation in March (yellow areas on the NWS Minnesota March precipitation map) with 3-5 inches from St. Cloud across nearly all of eastern Minnesota from Duluth through the Twin Cities to Hastings and Red Wing.
The combined January through March precipitation (6.23 inches, +3.23 inches from average) and the combined December through March precipitation (8.68 inches, +4.80 inches from average) placed as the secondmost, behind only 1896-1897 (8.68 inches).
Never Ending March 6
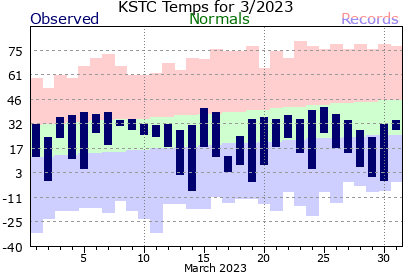
Temperature-wise, March was very similar to the previous 3 months. There were ups and downs, but the high temperatures were commonly in the 30's with low temperatures usually in the teens and 20's. Overall, St. Cloud had an average March temperature of 23.7 degrees with an average high of 33.4 degrees and an average low of 14.1 degrees. Those readings are close to the average readings on March 6, but 13-15 degrees colder than the end of March averages.While these type of readings produced a milder than average winter season (December through February), it did end up being -5.5 degrees colder than the March average. This March was St. Cloud's 41st coldest of 143 Marches on record.
There were 4 more lows of zero or colder, running the cold season total to 36 days, 6-7 days fewer than average. There were no below zero highs, so the seasonal total of 5 remained one more than average. However, there were no lows of -20 or colder; the coldest low was -18, set on January 30, 31, and February 3.
There were only three true arctic air outbreaks this winter::
- Dec 18-25: 3 straight highs of zero or colder; 9 straight lows of zero or colder (coldest: -13)
- Jan 28-Feb 3: 1 high of zero or colder; 8 straight lows of zero or colder (coldest: -18 on Jan 30, 31, Feb 3)
- Feb 24: one high in the plus single digits; 4 straight lows of zero or colder (coldest: -15 on Feb 24)
There was a fair amount of attention to the failure of Minneapolis-St. Paul International Airport to hit 50 degrees in March, for the first time since 2001. St. Cloud has not yet made it to 50 degrees yet this year. While the average date for the first 50-degree high is March 13, St. Cloud didn't record a 50-degree temperature until April 19 in 2018 and until April 26 in 2013.
Also, Minneapolis-St. Paul International Airport had 116 straight days with at least an inch of snow on the ground, the 9th longest streak in their records. St. Cloud still has the streak going (December 8 through April 3) at 117 days, but that's still 10 days short of the top 10. However, the end date for that streak will likely be among the 10 latest with a good chance of being in the top 4 (April 10 or later) if we get substantial snow from the storm in early April.
Why All the Snow?
The double band of storm tracks in the steering winds was responsible for the tendency of the cold season to not be extremely cold, but to be extremely snowy. The northern storm track tended to park across the Canadian Prairie Provinces. The really cold arctic air tends to pent up to the north of the northern storm track, so there were only a few pushes towards the northern US. Even then, the core of the coldest air tended to head across Ontario towards Quebec, the Canadian Maritime Provinces, and the Northeast. Occasional, the northern storm track brought a stronger storm further southward into Minnesota, which could produce narrow bands of plowable snow.
The southern storm track tended to set up from California to the Central Rockies, then shoot across the Plains. At times, this southern branch stayed south of Minnesota, giving Minnesota only small amounts of snow. But, occasionally, a stronger storm moved more northeastward than east-northeastward, bringing wetter storms to Minnesota. And, in the case of the two major snowfalls, the two branches worked together, creating a slow-moving storm and a prolonged period of precipitation. Given the mainly mild conditions during the winter, some of these southern storms produced snow mixed with ice at times, or even rain, especially in southern and eastern Minnesota.
Notable March snowfalls in Minnesota included
- Feb 28-March 1 in western and northern Minnesota
- March 11-12 heavy snow and whiteout conditions from a northern branch storm
- March 16-17 Snow and mixed precipitation with again strong winds
Why the Slow Thaw?
While the winter was relatively mild, the large amount of snow made it more difficult for temperatures to warm with the increasing sunshine. When temperatures are above freezing, some of the sun's energy that would normally go into heating the air is used instead to melt the snow.
And, the thawing and refreezing cycles has led to a bumper crop of potholes. The prolonged cool March weather has made it difficult to patch pavement effectively.
Why Us???
And, we have a strong northern track storm headed for Minnesota on April 4 and 5 with the potential of at least half inch of liquid and another huge snow dump, at least across northwestern and north central Minnesota
All of That Snow Has to Go Somewhere
The consequences of all of that snow (set to season accumulation on the NWS national gridded snowfall analysis) and so much remaining on the ground so late in the season is to increase the potential for snowmelt flooding both in the Red River basin (north flowing) and the Lake Superior and Mississippi River watersheds.
The latest update from the National Weather Service's North Central River Forecast Center were issued during the last week of March, both before the March 31 snow event and the potential April 4-5 storm. In the Red River and Devils Lake Basin, there is at least a 50% chance of moderate to major flooding from Wahpeton to the Canadian border. Some of the tributaries could also experience moderate to major flooding as they approach the Red River. In the Upper Mississippi, Chippewa, and St. Croix River Basins, and rivers dumping into Lake Superior, the snow pack is nearly at record levels, thanks to the 5th snowiest winter in Duluth and Brainerd being 1 inch from its snowiest winter on record. The potential for moderate to major flooding is relatively high, depending on future conditions. One factor favoring less of a flood is that the frost depth hasn't been that great since Minnesota was hit by heavy December snow before deep freezing could occur. So, more snowmelt than usual could seep into the ground, rather than just run off into lakes and rivers.
In the bulk of the Upper Mississippi, Minnesota, and Chippewa Valleys , most rivers have at least a 50-50 shot at moderate (red squares) or even major flooding (purple squares on the NCRFC long-range flood outlook). Note that St. Cloud is shown with a 50-50 chance of moderate flooding right now.
How Can I Limit the Risk?
The National Weather Service in Duluth (next to last slide) has some suggestions for home owners, including shoveling out drains, clearing ice dams, and shoveling around the foundation of the house. But, the most important preparation is to have gotten flood insurance in vulnerable areas. It may actually be too late now, since the policy must be purchased at 30 days in advancing of any flooding.
Everything now depends on how much precipitation we get during the snow melt and how warm it gets, dictating how fast the snow melt will be. Those are the most uncertain parts of the outlook, since they refer to the next 4-6 weeks of weather.
The consequences of the snowy cold season further west has generally been good across the mountains of the western third of the US. There has been major relief from California and Nevada to Utah (set dates to November 1, 2022 and the latest on the two week comparison of the US Drought Monitor) where there was huge snowfall. Parts of the Pacific Northwest into Idaho and the Salt Lake City area have not had a lot of snow and the Upper Colorado River Valley has also been short on snow. progress.
|
Temperatures (°F)
|
Mar 2023
|
Average
|
|
| Average High Temperature (°F) |
33.4
|
38.5
|
|
| Average Low Temperature (°F) |
14.1
|
19.8
|
|
| Mean Temperature for March (°F) |
23.7
|
29.2
|
|
|
March Extremes
|
Temperature(°F)
|
Date
|
|
| Warmest High Temperature for March 2023 (°F) |
42
|
March 25
|
|
| Coldest High Temperature for March 2023 (°F) |
13
|
March 17
|
|
| Warmest Low Temperature for March 2023 (°F) |
31
|
March 8
|
|
| Coldest Low Temperature for March 2023 (°F) |
-7 |
March 14
|
|
|
Temperature(°F)
|
Date
|
Old Record
|
|
| No Temperature Records Set | |||
|
Temperature Thresholds
|
Number of Days
|
Normal
|
|
| March 2023 Days with High Temperatures <= 32°F |
12
|
10.1
|
|
| Cold Season 2022-2023 Days with High Temperatures <= 32°F | 85 | 87.7 | |
| March 2023 Days with High Temperatures <= 0°F |
0
|
0.0
|
|
|
Cold-season 2022-2023 Days with High Temperatures <= 0°F |
4 |
4.3
|
|
| March 2023 Days with Low Temperatures <= 32°F |
31
|
28.0
|
|
|
Cold-season 2022-2023 Days with Low Temperatures <= 32°F |
161 |
155.4
|
|
| March 2023 Days with Low Temperatures <= 0°F |
4
|
3.5
|
|
|
Cold-season 2022-2023 Days with Low Temperatures <= 0°F |
36
|
42.7
|
|
| March 2023 Days with Low Temperatures <= -20°F |
0
|
0.0
|
|
|
Cold-season 2022-2023 Days with Low Temperatures <= -20°F |
0
|
5.4
|
|
| St. Cloud Historic -20°F Lows | Link to 10 Warmest/Coldest Marches | ||
|
Liquid Equivalent Precipitation (in)
|
March 2023
|
Normal
|
|
|
March 2023 Melted Precipitation (in)
|
2.87
|
1.57
|
|
|
March Extremes
|
Precipitation (in)
|
Date
|
|
|
Most Daily Precipitation in March 2023
|
1.04 inch
|
March 31
|
|
| Daily Precipitation Records |
Amount (inches)
|
Date
|
Old Record
|
| No records set | |||
|
Precipitation Thresholds
|
Number of Days
|
Normal
|
|
| March 2023 Days with Measurable (>= 0.01 inch) Precipitation |
13
|
7.1
|
|
| March 2023 Days with >= 0.10 inch Precipitation |
7
|
3.3
|
|
| March 2023 Days with >= 0.25 inch Precipitation |
3
|
1.8
|
|
| March 2023 Days with >= 0.50 inch Precipitation |
2
|
0.7
|
|
| March 2023 Days with >= 1.00 inch Precipitation |
1
|
0.1
|
|
| Link to 10 Wettest/Driest Marches | Complete list of Saint Cloud March Records | ||
|
Snowfall (in)
|
March 2023
|
Normal
|
|
|
March 2023 Saint Cloud Airport Snowfall (in)
|
23.5 (4th highest)
|
8.2
|
|
|
2022-2023 Seasonal Snowfall (1 Oct 2022 - 31 March 2023)
|
84.0 (3rd highest)
|
43.1
|
|
|
Snowfall Thresholds
|
Number of Days
|
Average
|
|
| March 2023 Days with Measurable (>= 0.1 inch) Snowfall |
9
|
5.3
|
|
| 2022-2023 Cold Season Total Days with Measurable (>= 0.1 inch) Snowfall |
|
|
|
| March 2023 Days with >= 1.0 inch Snowfall |
6
|
2.8
|
|
| 2022-2023 Cold Season Total Days with >= 1.0 inch Snowfall |
23 (one short of record from 1935-1936, 1940-1941, 1996-1997, 2010-2011)
|
14.0.
|
|
| March 2022 Days with >= 2.0 inch Snowfall |
5
|
1.5
|
|
| 2021-2022 Cold Season Total Days with >= 2.0 inch Snowfall |
16 (record; old record 15 in 1950-1951)
|
7.6
|
|
| March 2023 Days with >= 5.0 inch Snowfall |
1
|
0.1
|
|
| 2022-2023 Cold Season Total Days with >= 5.0 inch Snowfall |
5 (tied for second; 9 in 1936-1937)
|
1.4
|
|
|
March Extremes
|
Snowfall (in)
|
Date
|
|
|
Most Daily Snowfall (in) in March 2022
|
5.0
|
March 16
|
|
| Daily Snowfall Records |
Amount (inches)
|
Date
|
Old Record
|
| No records set | |||
Last Updated: April 3, 2023
Send comments to: Bob Weisman


Send comments to: raweisman@stcloudstate.edu