July 2025 Saint Cloud Weather Summary
|
Lows of at least 70°F
|
|||
|
July 27-28 Severe Storms and Flooding
|
Rains, Humidity Persisted in July, Setting June-July Rainfall, 27 Month Temperature Marks
July 2025 St. Cloud, MN Weather Summary
Rains Continued (7th Wettest June-July in St. Cloud Records)
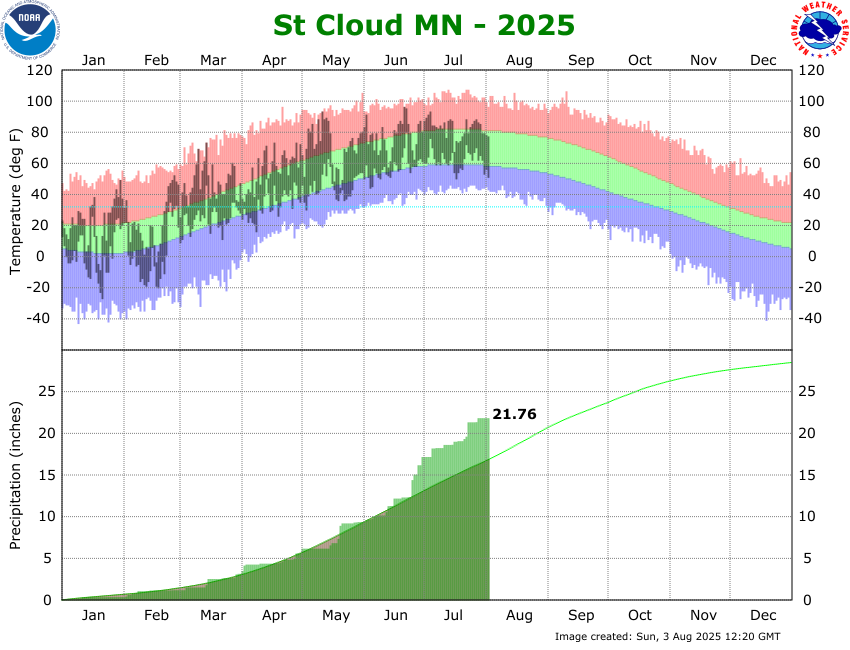
The wet weather pattern from June continued to a large degree in July, except that the heaviest rainfall was spotty. St. Cloud had 11 days with measurable rainfall in July 2025, fewer than the 16 days in July. However, major rainfall on the 5th and again during the 21-23 pushed the July rainfall to 4.66 inches, 1.06 inches above average. The July rainfall total combined with the 7.81 inches of June rain (th rainiest June on record) to produce 12.47 inches since June 1, 5.12 inches above average (see the surge of rainfall from nearly average going into mid-June, along green line, to well above average on the 2025 St. Cloud accumulated rainfall graph from NWS Twin Cities). That's the 7th wettest first two months of meteorological summer in St. Cloud records and the wettest since 1990 (see table below). The wettest June-July combination was set in 1897 with nearly 20 inches of rain (average annual St. Cloud rainfall: 28.49 inches). Note that the number 1, 5, and 9 totals were aided by some of St. Cloud's rainiest months on record (see top 10 of St. Cloud rainiest months), including June 1990 (10.52 inches)
|
St. Cloud's 10 Wettest June-July Avg: 7.35 inches |
||
| Rank | Rainfall (in) | Year |
| 1 | 19.89 | 1897 |
| 2 | 15.67 | 1990 |
| 3 | 12.83 | 1905 |
| 4 | 12.58 | 1951 |
| 5 | 12.54 | 1913 |
| 6 | 12.48 | 1952 |
| 7 | 12.47 | 2025 |
| 8 | 11.79 | 2015 |
| 9 | 11.73 | 1983 |
| 10 | 11.55 | 1986 |
The July 21-23 series of storms produced flooding in various parts of Minnesota. A repeating band of heavy thunderstorms in central Minnesota on the morning of July 23 produced a swath of heavy rain (3-5 inches) from Albany and Freeport to Rice (set NWS Water Prediction Service map date to July 24, covering 7 AM on the 23rd to 7 AM on the 24th. Other flooding occurred in Bemidji and Ely (see Minnesota Public Radio story with embedded videos). That period produced the St. Cloud Regional Airport has picked up 2.26 of the 4.66 July total.
Later in the month, a series of severe storms produced severe weather, including damaging winds, large hail, and more flooding on July 27-28. Morris (set date on NWS Water Prediction Service map to July 29 and total to 2 days) and west central Minnesota picked up three and a half to 6 inches of rain, causing more flooding.
For the usual growing season so far (April 1-July 31), St. Cloud has received 18.68 inches of precipitation, 5.06 inches above average. Note that the growing season didn't really begin this year until all of the April 1-3 snow melted and the ground thawed. Even though much of the southern two-thirds of Minnesota is in the blue on the top graph (at least 2 inches more than average on the top map, which is the Minnesota growing season rainfall difference from the Minnesota DNR), there is a stripe of relatively low rainfall (yellow, between 0 and an inch below average on the Minnesota growing season rainfall difference from the Minnesota DNR) covering Brainerd, Aitkin, and northern Mille Lacs Lake. During all of 2025 so far (again see 2025 St. Cloud accumulated rainfall graph from NWS Twin Cities), the St. Cloud rainfall is 21.76 inches, 5.14 inches above average. That's the 17th highest 7-month rainfall in St. Cloud records; however, St. Cloud had even more last year (22.90 inches, 8th wettest Jan-July).
Warmth, Mostly Fueled by Mild Low Temperatures
The St. Cloud Regional Airport had a 72.6 degree average temperature in July, 2.3 degrees above average, and the 44th warmest of the 144 Julys on record. While temperatures were consistently warm in July, the average high of 82.8 degrees (2 days with a 90-degree high) was only 1.2 degrees above average. The average July 2025 high was actually a degree cooler than July 2024 (4 90-degree highs) and 1.3 degrees cooler than July 2023 (7 90-degree highs). Yet, the past 2 Julys were warmer in overall temperature average than July 2023. The reason was the heavy rainfall mentioned above. Even though July was not as rainy as June, the frequent rain and the surrounding wet grounds provided plenty of water to evaporate, even between storm systems. Except for breaks of central Canada air during July 16-20 and the last day of the month, the dew points were usually in the uncomfortable 60's or even higher.Since the dew point marks the lowest possible temperature on a clear and calm night, the lingering humidity helped to produce a 62.3 degree July 2025 low, 3.4 degrees warmer than normal July low temperature. That was St. Cloud's 13th mildest average July low and the warmest since 2011 and 2012. This included 3 more lows of 70-degrees or warmer, running the seasonal total to 6 days. Lows in the 70's (3.0 per year) are about as common in St. Cloud as -20 degree lows during the winter (5.4 days per cold season). On July 4, the low only reached 76 degrees, the second low of at least 75 degrees this summer. 75-degree lows (56 days in the St. Cloud records dating back to 1893) are as rare as 100-degree highs (60 days in the St. Cloud records).
July 2025 continued a streak of above average temperature that has dominated the past two years. Since April 2023, the last month of our record-snowfall season, all months, except February 2025, have been warmer than average (see table below). It was not quite as extreme in August 2024-July 2025 (46.0 degrees, warmest in St. Cloud history) as it was in August 2023-July 2024 (48.7 degrees, warmest in St. Cloud history). That's because we had a typical El Nino (unusually warm ocean temperatures off Mexico) cool season weather pattern in 2023-2024 (8th warmest fall; warmest winter on record; 8th warmest spring), thanks in large part to the record warm ocean temperatures. That episode ended during last fall, but St. Cloud still had its 7th warmest August through July on record during the past year. This is consistent with the global temperature record, which continue to post top-10 warmest years since the middle of the 2010's.
The entire 27 month period since April 2023 is the warmest such period in St. Cloud records, by more than a degree.
| St. Cloud Monthly Temperatures and Anomalies April 2023-July 2025 | ||||||||||||||||||||||||||||||
| Year |
2023
|
2024
|
2025
|
|||||||||||||||||||||||||||
| Month | Mar | Apr | May | June | Jul | Aug | Sep | Oct | Nov | Dec | Jan | Feb | Mar | Apr | May | June | Jul | Aug | Sep | Oct | Nov | Dec | Jan | Feb | Mar | Apr | May | June | Jul | Tot |
| Temp (°F) | 23.8 | 40.8 | 62.5 | 71.5 | 70.4 | 70.6 | 65.6 | 49.4 | 35.3 | 32.1 | 19.4 | 30.4 | 34.1 | 47.4 | 60.2 | 67.3 | 72.7 | 69.9 | 67.0 | 52.9 | 35.7 | 22.2 | 12.4 | 12.3 | 35.9 | 45.0 | 58.2 | 67.1 | 72.6 | 48.8 |
| Anomaly(°F) | -5.4 | -2.5 | +6.3 | +5.5 | 0.1 | +3.9 | +6.1 | +3.7 | +4.3 | +14.3 | +7.6 | +14.3 | +4.9 | +4.1 | +4.0 | +1.3 | +2.7 | +2.2 | +7.5 | +7.2 | +4.8 | +4.4 | 0.6 | -3.8 | +6.7 | +1.7 | +2.0 | +1.1 | +2.3 | +4.2 |
| Rank (of 144) | 104th | 112th | 9th | 5th | 80th | 23rd | 3rd | 31st | 21st | 1st | 11th | 1st | 20th | 28th | 20th | 42nd | 39th | 41st | 1st | 9th | 16th | 24th | 50th | 100th | 13th | 53rd | 44th | 44th | 41st | 1st |
How Much of This Warmth Can Be Tied Directly to Global Warming Trend?
The warmth in St. Cloud this summer, especially in July, can be directly tied to the persistent humidity from the rainy warm season we are having. And, the fire season in Canada can be directly linked to the lack of precipitation, especially since the start of the spring. The bulk of the rain from the heavy thunderstorms has either been in the northern tier of the US, reaching occasionally into south central Canada. And, another below average snow season preceded this warm season. But, how much of this area weather can be related to the global warming trend?
Since global warming is climate change (conditions all over the world averaged over 30 years), not day-to-day or even monthly weather at one place (even in 2024, there were a few places that were cooler than average -- Greenland, southeastern Alaska, southern South America), St. Cloud recent temperature records cannot be used to prove (or disprove) that global warming is ongoing. Even for global temperatures, meteorologists have to look at the past 30 year average and compare it to the previous 30 year average. The proof of warming in that record is the major warming since 1850 in two waves: a major warming from the 1900's to the 1930's (followed by a leveling over the next 30 years), and the warming since the middle of the 1970's.
However, St. Cloud's recent temperature trends (warmer than average, especially during the cooler months) are consistent with the predictions of global warming, that interior of northern continents would expected to have higher average temperatures, especially for low temperatures and during the cooler months.
When Winds Shifted to North, Smoke Often Moved In
On the other hand, when Canadian air blew, those winds carried the smoke from Canadian wildfires, especially the worsening conditions in Saskatchewan, Manitoba, and Ontario. The July 11-13 period ended up coming with more smoke from Canadian wildfires, plaguing outdoor activities in the Boundary Waters. Then, a late month smoke inflow allowed serious air pollution indices in northern Minnesota on the 24th and 25th and statewide at the end of the month (select Daily AQI and go to July calendar on the MPCA past data site; push a date to see the worst readings). The longer mid-month period of low humidity (5 straight lows in the 50's) did occur when some rain showers across south central Canada washed out some of the low-level smoke.
|
Lows of at least 70°F
|
|||
|
July 27-28 Severe Storms and Flooding
|
July 2025 Statistics
|
Temperatures (°F)
|
July 2025
|
1991-2020 Normals
|
|
| Average High Temperature (°F) |
82.8
|
81.6
|
|
| Average Low Temperature (°F) |
62.3
|
58.9
|
|
| Mean Temperature for July (°F) |
72.6
|
70.3
|
|
| Daily St. Cloud July Records | 10 Hottest/Coldest Julys | ||
|
July Temperature Extremes
|
Temperature(°F)
|
Date
|
|
| Warmest High Temperature for July 2025 (°F) |
93
|
July 4
|
|
| Coldest High Temperature for July 2025 (°F) |
73
|
July 18
|
|
| Warmest Low Temperature for July 2025 (°F) |
76
|
July 4
|
|
| Coldest Low Temperature for July 2025 (°F) |
50
|
July 17
|
|
|
Record Temperatures in July 2024
|
Temperature (°F)
|
Date
|
Old Record
|
|
No daily temperature records set
|
|||
|
Temperature Thresholds
|
Number of Days
|
Normal
|
|
| July 2024 Days with High Temperatures >= 90°F |
2
|
4.67
|
|
| 2024 Total Days with High Temperature of At Least 90°F |
6
|
11.43
|
|
| 2024 Total Days with High Temperature of At Least 100°F |
0
|
0.51
|
|
| July 2025 Days with Low Temperatures >= 70°F |
4
|
1.72
|
|
| 2024 Total Days with Days with Low Temperatures of At Least 70°F |
6 (most since 2013)
|
3.02
|
|
| July 2024 Days with Low Temperatures >= 75°F |
1 (Last: July 4, 2012)
|
0.26
|
|
| 2024 Total Days with Days with Low Temperatures of At Least 75°F |
2
|
0.47
|
|
|
Precipitation (in)
|
This Year
|
1991-2020 Normals
|
|
|
July 2025 Rainfall (in)
|
4.66
|
3.60
|
|
|
June-July 2025 Rainfall (in)
|
12.47 (7th wettest on record)
|
7.35
|
|
| 2025 Growing Season Rainfall (April 1 through July 31) |
18.68 (19th rainiest on record)
|
13.62
|
|
| January-July 2025 Precipitation (in) |
21.76 (17th wettest on record)
|
16.62
|
|
|
July Precipitation Extremes
|
Precipitation (in)
|
Date
|
|
|
Most Daily Precipitation in July 2025
|
1.72
|
July 23
|
|
|
Record Precipitation in July 2024
|
Precipitation (in)
|
Date
|
Old Record
|
| No records set | |||
|
Precipitation Thresholds
|
Number of Days
|
Normal
|
|
| July 2025 Days with Measurable (>= 0.01 inch) Precipitation |
11
|
9.3
|
|
| Jan-July 2025 Days with Measurable (>= 0.01 inch) Precipitation |
69
|
50.1
|
|
| July 2025 Days with >= 0.10 inch Precipitation |
7
|
5.9
|
|
| Jan-July 2025 Days with >= 0.10 inch Precipitation |
40
|
26.8
|
|
| July 2025 Days with >= 0.25 inch Precipitation |
7
|
4.1
|
|
| Jan-July 2025 Days with >= 0.25 inch Precipitation |
28
|
19.9
|
|
| July 2025 Days with >= 0.50 inch Precipitation |
2
|
2.5
|
|
| Jan-July 2025 Days with >= 0.50 inch Precipitation |
14
|
10.3
|
|
| July 2025 Days with >= 1.00 inch Precipitation |
2
|
1.2
|
|
| Jan-July 2025 Days with >= 1.00 inch Precipitation |
5
|
3.1
|
|
|
Lows of at least 70°F
|
|||
|
July 27-28 Severe Storms and Flooding
|
Last Updated: August 1, 2025


Send comments to: raweisman@stcloudstate.edu