March 2026 Saint Cloud Weather Summary
Summary Links
- March 2026 Monthly Statistics
- March Daily Records
- 10 Warmest/Coldest Marches
- March Minnesota Precipitation (from NWS Water Prediction Services)
- US Drought Monitor
- March 12-13: N Minnesota Snow and Statewide Extreme Winds
- March 14-15 Central Minnesota Blizzard
- March 21 Record Heat
Up-And-Down March (With Mild Feb.) Overcomes Cold Dec-Jan
Saint Cloud, MN, March 2026 Weather Summary
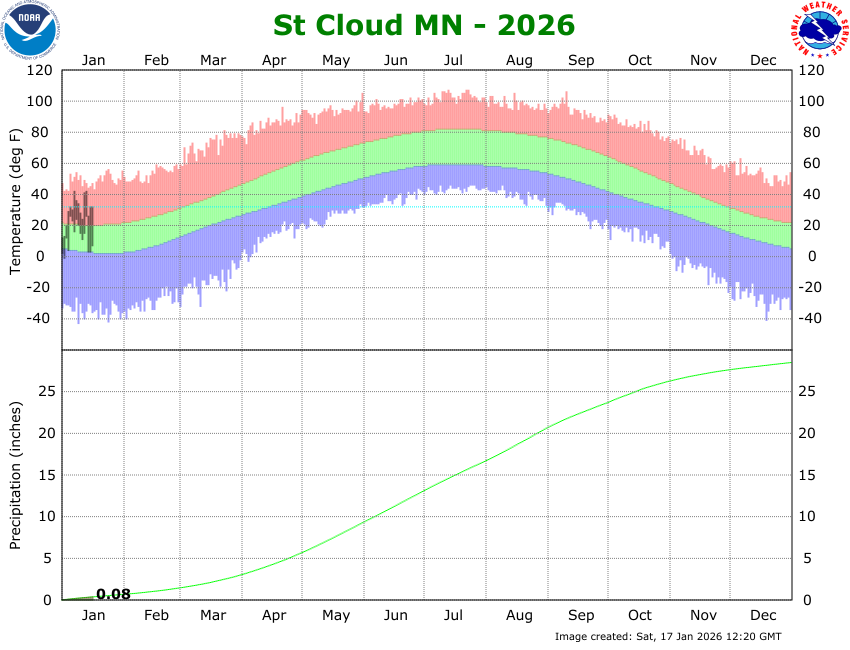
The March 2026 daily St. Cloud high-low temperature graph looks a lot like the heart monitor graph (EKG) for a healthy person with a lot of highs and lows (very few of the bars were within the green area surrounded by the average high and low), but the warm days (12 days at least 10 degrees above average and 3 days at least 20 degrees above average) outnumbered the cold days (2 days 20 or more degrees below average). The net result was a 34.8ºF average temperature, 5.6ºF above the March normal. That ranks as the 18th mildest March of the 146 Marches in St. Cloud records.
More importantly, having both February and March end up more than 5 degrees warmer than normal meant that the February-March average temperature in St. Cloud was 29.3ºF, 8.3 degrees warmer than normal. That is the 7th warmest February-March combination in St. Cloud records (see table below):
| Rank | Feb-March Temp (ºF) | Year |
| 1 | 34.3 | 2012 |
| 2 (tie) | 32.3 | 1987 |
| 2 (tie) | 32.3 | 2024 |
| 4 | 30.3 | 2016 |
| 5 | 29.9 | 1998 |
| 6 | 29.8 | 2000 |
| 7 | 29.3 | 2026 |
| 8 | 28.4 | 1999 |
| 9 | 28.3 | 1961 |
| 10 | 28.2 | 1981 |
Note that 7 of the 8 mildest February-March years have occurred during the spell of much milder cold seasons from 1997-1998 on. Even though both December 2025 and January 2026 had average temperatures more than 2 degrees colder than normal, the entire November 2025 through March 2026 average temperature was 23.2 degrees, the 24th mildest November-March period (3.5 degrees milder than average).
The month included 2 days with a high of at least 70 degrees (tied for 4th most March days with 5 other Marches; record is 8 days, set in 1910) and 5 days with a high of at least 60 degrees (tied for the 10th most on record). On the other hand, March 17 had a low colder than zero. The only record temperature set was on March 21 with a record-tying average temperature of 57.
Cold Season Milestones Close to Average, But Still Mild
The cold season thus far has approached typical levels for cold temperatures:
- 71 days with a high of freezing or colder (average: 87.7 days)
- 4 days with a high of zero or colder (average: 4.3 days)
- 146 days with a low of freezing or colder (average through March: 154.8 days)
- 32 days with a low of zero or colder (average: 42.7 days)
- 4 days with a low of -20 or colder (average: 5.4 days)
So, when it was cold during this cold season, it was significantly cold, but there were too many warm interludes to get the entire season colder than average.
Need Major Spring Precipitation to Recharge Ground Moisture
The biggest weather-related issue for Minnesota this spring is the aftermath of the very dry late summer and fall. St. Cloud's August through November precipitation was only 5.64 inches (average: 10.99 inches). It was even drier in much of northern and southwestern Minnesota, so the US Drought Monitor has these areas listed in the severe drought category.
Cold Season Liquid and Snow Slight Below Average
The St. Cloud total melted precipitation during the cold season (4.32 inches November through March, 0.93 inch under the 5.25 inch average) was a bit below average, including in March (1.47 inch actual, 0.10 inch under average). Still, that precipitation mainly fell on frozen ground, so that total, including the 38.3 inches of snow, 4.8 inches below average (7.6 March inches, 0.6 inch below average), drained into rivers and lakes, when it melted, but doesn't help the ground water situation. So, we will need major spring precipitation to help the upcoming growing season (April 2-4 got Minnesota off to a good start).
St. Cloud Brushed By One of Two Major March Snow Storms
The March 14-15 storm, which produced major blizzard conditions in parts of the Minnesota River Valley through the Twin Cities, dropped a total of 5.9 inches of snow on St. Cloud, the largest single-storm snowfall of the cold season. St. Cloud was completely missed by the first storm from two days earlier that dropped over 10 inches of snow on the North Shore.
The snow shortfall (2-4 feet of snow total, orange and yellow) during the cold season hasn't carried over to much of northern Minnesota (4-6 feet total, red, for the season; set NWS NOHRSC National Gridded Snowfall Analysis to season accumulation).
Another big factor in the NWS NOHRSC National Gridded Snowfall Analysis season accumulation is the huge gap in the Southern Rockies, concentrated over the Colorado River Valley. That will lead to major problems during the warm season.
March 2026 Statistics
| Temperatures (°F) | March 2026 | Normal | |
|---|---|---|---|
| Average High Temperature (°F) |
45.6
|
38.5
|
|
| Average Low Temperature (°F) |
23.9
|
19.8
|
|
| Mean Temperature for March (°F) |
34.8 (18th mildest March of 146)
|
29.2
|
|
| Feb-Mar 2026 Mean Temperature (°F) |
29.3 (7th mildest Feb-March of 146)
|
21.0 (entire record)
|
|
| Temperature Thresholds | Number of Days | Normal | |
| March 2026 Days with High Temperature of 32°F or lower |
6
|
10.0
|
|
| Cold Season 2025-2026 (Oct-Mar) Days with High Temperature of 32°F or lower |
71
|
86.0
|
|
| March 2026 Days with Low Temperature of 32°F or lower |
23
|
27.7
|
|
| Cold Season 2025-2026 (Oct-Mar) Days with Low Temperature of 32°F or lower |
125
|
154.8
|
|
| March 2026 Days with High Temperature of 0°F or lower |
0
|
0.0
|
|
| Cold Season 2025-2026 (Oct-Mar) Days with High Temperature of 0°F or lower |
4
|
4.3
|
|
| March 2026 Days with Low Temperature of 0°F or lower |
1
|
3.5
|
|
| Cold Season 2025-2026 (Oct-Mar) Days with Low Temperature of 0°F or lower |
32
|
42.4
|
|
| March 2026 Days with Low Temperature of -20°F or lower |
0
|
0.05
|
|
| Cold Season 2025-2026 (Oct-Mar) Days with Low Temperature of -20°F or lower |
4
|
5.42
|
|
| March Temperature Extremes | Temperature (°F) | Date | |
| Warmest High Temperature for March 2026 (°F) |
73
|
March 21
|
|
| Coldest High Temperature for March 2026 (°F) |
16
|
March 16
|
|
| Warmest Low Temperature for March 2026 (°F) |
40
|
March 21
|
|
| Coldest Low Temperature for March 2026 (°F) |
-3
|
March 17
|
|
| Record Temperatures in March 2026 | |||
| Event | Temperature (°F) | Date | Old Record |
| Daily Warm Average Temperature | 57 (tie) | March 21 | 57 in 1938, 2012 |
| Precipitation (in) | March 2026 | Normal | |
| March 2026 Precipitation (in) | 1.47 (-0.10 from average; 104th driest Mar) | 1.57 | |
| Precipitation Thresholds | Number of Days | Normal | |
| March 2026 Days with Measurable (>= 0.01 inch) Precipitation | 11 | 7.1 | |
| March 2026 Days with >= 0.10 inch Precipitation | 5 | 3.3 | |
| March 2026 Days with >= 0.25 inch Precipitation | 2 | 1.8 | |
| March 2026 Days with >= 0.50 inch Precipitation | 0 | 0.7 | |
| March 2026 Days with >= 1.00 inch Precipitation | 0 | 0.1 | |
| March Precipitation Extremes | Precipitation (in) | Date | |
| Most Daily Precipitation in March 2026 | 0.47 inch | March 6 | |
| Precipitation Records Set | Amount (in) | Date | Old Record |
| No Records Set |
-
|
-
|
-
|
| Snowfall (in) | This Season | Normal | |
|
March 2026 Snowfall (in)
|
7.6 (69th brownest March)
|
8.2
|
|
|
Cold Season 2025-2026 (Oct-Mar) Snowfall (in)
|
38.3
|
43.1
|
|
| Snowfall Thresholds | Number of Days | Normal | |
|
March 2026 Days with Measurable (>= 0.1 inch) Snowfall
|
6
|
5.09
|
|
|
Cold Season 2025-2026 (Oct-Mar) Days with Measurable (>= 0.1 inch) Snowfall
|
29
|
29.84
|
|
|
March 2026 Days with >= 1.0 inch Snowfall
|
3
|
2.60
|
|
|
Cold Season 2025-2026 (Oct-Mar) Days with >= 1.0 inch Snowfall
|
11
|
13.20
|
|
|
March 2026 Days with >= 2.0 inch Snowfall
|
2
|
1.52
|
|
|
Cold Season 2025-2026 (Oct-Mar) Days with >= 2.0 inch Snowfall
|
8
|
7.10
|
|
|
March 2026 Days with >= 5.0 inch Snowfall
|
0
|
0.39
|
|
|
Cold Season 2025-2026 (Oct-Mar) Days with >= 5.0 inch Snowfall
|
3
|
1.41
|
|
| March Snowfall Extremes | Snowfall (in) | Date | |
|
Most Daily Snowfall in March 2026
|
3.0 inches
|
March 14 | |
|
Snowfall Records Set
|
Amount (in) |
Date
|
Old Record |
|
No Records Set
|
-
|
- | |
Last Update: 6 April 2026


Send comments to: raweisman@stcloudstate.edu