May and Spring 2025 Saint Cloud Weather Summary
Rain, Lack of Rain (and Its Effects) Highlight St. Cloud's May
May and Spring 2025 Saint Cloud Weather Summary
Both rain and lack of rain dominated the weather-related headlines during May 2025 in St. Cloud, Minnesota. All of Minnesota still needed rain after having a dry fall (3.61 inches in St. Cloud versus 6.99 inch average) and, in northern and western Minnesota, a dry second half of summer 2024. As the weather pattern shifted from a pair of storm tracks (one often too far north of Minnesota to help, and the other often too far south) to large slow-moving systems, much of central and southern Minnesota picked a major rain storm on May 19-21. Rainfall of 2-3 inches was common in central and southern Minnesota, while far northern Minnesota got shut out, accounting for the large difference in total May rainfall (less than an inch, light green, in north central, northeastern, and southwestern Minnesota, while more than 3 inches, tan, in much of central Minnesota and over 4 inches, darker tan from Sauk Centre and St. Cloud to the Minnesota River and the central Twin Cities). The Saint Cloud Regional Airport picked up 2.38 inches during the storm, including 1.57 inch on May 20, which was 0.15 short of the daily rainfall record. That made up the bulk of May's rainfall total: 3.77 inches, +0.11 inch from average. So, the mid-May rain made up 63% of monthly rainfall.
April-May Rain Not Enough to Make Up Fall Rainfall Shortage
The relative lack of rain the rest of the month and a near average April meant that the growing season (April-May) precipitation (yeah, there were 6.0 inches of April snow that most of us wanted to forget) is 6.21 inches, near the two-month average (6.27 inches). Since March, much of northern and western Minnesota have seen less than 6 inches of precipitation (middle and light green on the Minnesota 90-day rainfall ending June 1). That's where the remaining areas of moderate drought are shown on the US Drought Monitor. Some of the rain shortfall goes back to late summer of last year. From the beginning of St. Cloud's dry period (September 2024) through May 31, the Regional Airport has picked up 13.37 inches of precipitation, still 3.77 inches below average and the 31st lowest September through May precipitation total in St. Cloud records.
Where Rainfall was Lacking, Fire and Smoke Were Problems
Areas where rain was lacking had a slow greening of ground vegetation. The frequently strong winds, often warm daytime temperatures, and low air moisture combined to produce many days of elevated or extreme fire danger. Before the mid-May rains, even central Minnesota had a few scattered wildfires. However, the major fires developed (see May 10-14 Heat That Sparked Wildfires) and are on-going in northeastern Minnesota. In addition, an extremely dry and warm spring has produced huge wildfires in the Canadian Prairie Provinces (see North America Active Wildfires), forcing some Canadian evacuations, and steering the smoke particles at times into Minnesota. Northeastern Minnesota had mid-May days with air quality issues due to the local fires (set Minnesota Pollution Control Agency air quality index calendar to May 11-13).
However, a major surge in Canadian wildfire smoke produced reduced sunshine throughout Minnesota at the end of May with some of the most extreme levels of poor air quality index moving in during June 1-3. The air quality index was purple for an extended period on June 2-4 (set MPCA air quality index calendar to June) in parts of Minnesota from northwest to southeast with the worst values on the third (see Late May-Early June Smoke Outbreak).
Since enough rain to douse the large Canadian wildfires is unlikely, parts of Minnesota will probably see more incursions of thick smoke near the ground a few times during the summer months.
Warmer than Average Temperatures, Interrupted by Mid-Month Chill
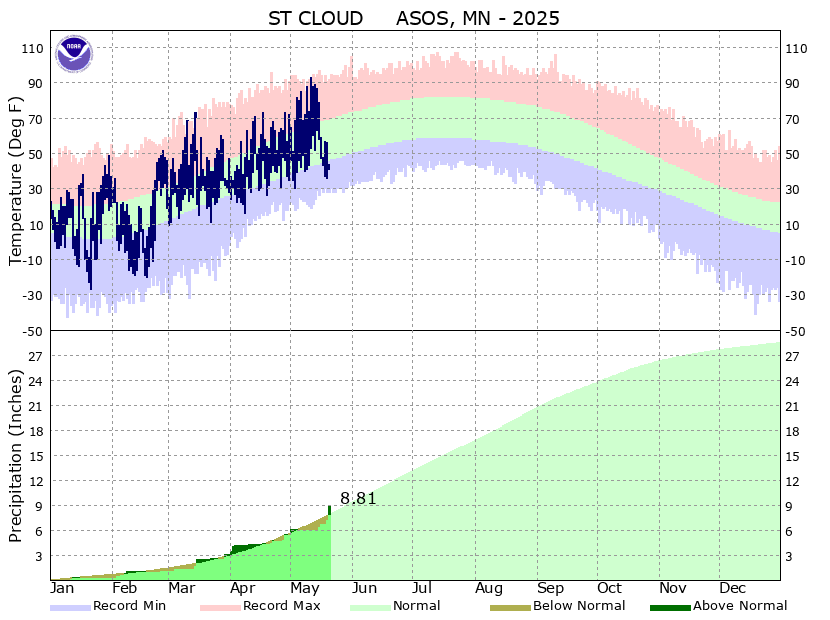
May temperatures returned to the pattern seen most often this past winter (note the same general shape of the St. Cloud high-low temperature curve in January, February and May). The month began with average to above average temperatures and finished similarly, but there was a notable cold spell just after mid-month. The hot weather produced 4 record warm temperatures during May 10-14, including a 93-degree high, a record warm high and the first 90-degree high of the season, on May 11. However, high pressure began draining in Canadian air during the middle of the month. On persistently cloudy days, record cool highs were approached and set. The May 17th high of 48 degrees, tied the record cold high. During the major May 19-21 rain storm, the coolest high of the month was set on May 20th high of 44, but it was one degree above the record cold high of 43. Taking the month as a whole, St. Cloud's average May temperature was 58.2 degrees (avg. high: 71.3 degrees; avg. low: 45.2 degrees). That 58.2 average turned out to be 2.0 degrees above the May average and the 44th warmest May of 145 Mays on record.
For meteorological spring (March 1-May 31), St. Cloud had an average temperature of 46.4 degrees (avg. high: 58.3 degrees; avg. low: 34.5 degrees), the 13th warmest spring on record.
Far More Warm Records Than Cold Ones In 2020's (Corrected, Thanks to Corey Daubanton)
Going back to the record temperatures, the hot period on May 11-14 produced a total of 4 record warm temperatures broken. On the other hand, the May 17th record cool high was the first daily record cool temperature of any type since temperatures topped out at a 37 degree high (tie) on April 21, 2023. That was a result of having the record seasonal snowfall around until late April in 2022-2023. The more recent record cold low was set more than 4 years ago: 21 degrees, tying a record on April 21, 2021. During the winter months, St. Cloud's most recent record cold highs (-6 and -6) happened on February 5 and 6 of 2021. St. Cloud hasn't set a record cold low during the winter months since February 27, 2014 (at -20). During the 2020's, St. Cloud has had 107 days with a record warm temperature and only 21 days with a record low temperature.
| Number of St. Cloud Record Daily Temperatures 2020-2025 | ||||
| Number of Days | High Temp. | Avg. Temp. | Low Temp. | Total Record Days |
| Warm Records | 36 | 42 | 29 | 107 |
| Cold Records | 9 | 5 | 7 | 21 |
The large number of warm temperature records means that St. Cloud has shared in the well-above average temperatures that has been seen worldwide. A better indicator would be the annual average temperatures. However, there will be warm spots and cold spots in any given year, so the temperature at any one place can't be used to either prove or disprove global warming. The predictions of a globally warmed climate tend produce warmer temperatures, especially during the cold season and especially at northern latitudes. The large number of temperature records in St. Cloud would be consistent with that prediction. However, June has produced a number of the hot temperature records, so there have been some hot summer spells, especially during June 2021 and 2022. On the other hand, the lack of cold temperature records, especially during the winter months, indicate that St. Cloud has had colder than average temperature outbreaks, notably with some bitter wind chills. While some of these air masses have been cold enough to set cold temperature records when this air has moved on to the central and southern US, that cold has not been nearly as the type of cold we had frequent in the 1970's (1976-1977 in particular), and the middle 1990's, including the Minnesota record cold outbreak from late January into early February, 1996. The winter of 2013-2014 is the lone winter ranking in the coldest 10 winters since 1981-1982.
| St. Cloud First Spring Temperature Thresholds 2025 | ||||||
| Median | Latest Ever | Latest 10% | Earliest Ever | Earliest 10% | ||
| First 50-degree high | Feb 26 | March 13 | April 26, 2013 | April 6 | Jan 5, 2012 | Feb 16 |
| First 60-degree high | March 10 (69) 9th earliest | April 4 | April 26, 1947, 1965, and 2013 | April 16 | March 3, 2005, 2024 | March 14 |
| First 70-degree high | March 14 (73) tied for 3rd earliest | April 17 | May 16, 1996 | May 3 | March 3, 2024 | March 27 |
| First 80-degree high | May 4 | May 4 | June 21, 1945 | May 26 | April 4, 1921 and 1929 | April 13 |
| Last Frost | May 3 | May 7 | June 1, 1993 | May 23 | April 24 | |
| *Select NOW Data, St. Cloud area, Daily for a month | ||||||
|
Temperatures (°F)
|
May 2025
|
Normal
|
|
| Average High Temperature (°F) |
71.3
|
68.8
|
|
| Average Low Temperature (°F) |
45.2
|
44.2
|
|
| Mean Temperature for May (°F) |
58.2 (20th warmest)
|
56.5
|
|
|
Temperature Thresholds
|
Number of Days
|
Normal
|
|
| May 2025 Days with High Temperatures =>90°F |
1
|
0.04
|
|
| May 2025 Days with Low Temperatures <= 32°F |
1
|
2.8
|
|
|
Cold-season 2024-2025 Days with Low Temperatures <= 32°F |
156 (8th fewest)
|
170.4
|
|
|
Cold-season 2024-2025 Days with High Temperatures <= 32°F |
72 (22nd fewest)
|
87.7
|
|
|
|
Spring First/Last High Temperatures | ||
|
May Extremes
|
Temperature(°F)
|
Date
|
|
| Warmest High Temperature for May 2025 (°F) |
93 (broke daily record, see below)
|
May 17
|
|
| Coldest High Temperature for May 2025 (°F) |
44
|
May 20
|
|
| Warmest Low Temperature for May 2025 (°F) |
63 (tied daily record, see below)
|
May 14
|
|
| Coldest Low Temperature for May 2025 (°F) |
30 (last frost, see below)
|
May 3
|
|
| Last Frost |
May 3
|
May 7
|
|
| Record Temperatures in May 2025 |
Temperature(°F)
|
Date
|
Old Record
|
| Daily Record Warm High |
93
|
May 11
|
90 in 1900, 1911
|
| Daily Record Warm Low |
60 (tie)
|
May 12
|
60 in 1906
|
|
63 (tie)
|
May 14
|
63 in 1998
|
|
| Daily Record Warm Average |
74
|
May 12
|
73 in 1906
|
| Daily Record Cold High |
48 (tie)
|
May 17
|
48 in 1961, 1968
|
|
Precipitation (in)
|
May 2025
|
Normal
|
|
|
May 2025 Precipitation (in)
|
3.77 (+0.11 from average)
|
3.66
|
|
| Growing Season (April-May) Precipitation (in) |
6.21 (-0.56 from average)
|
6.27
|
|
| January-May 2025 Precipitation (in) |
9.29 (+0.02 from average)
|
9.27
|
|
| September 2024-May 2025 Precipitation (in) |
13.37 (-3.77 from average, 31st lowest)
|
17.14
|
|
|
May Extremes
|
Precipitation (in)
|
Date
|
|
|
Most Daily Precipitation in May 2025
|
1.57 inch
|
May 20
|
|
|
Record Precipitation in May 2025
|
Precipitation (in)
|
Date
|
Old Record
|
| No Daily Rainfall Records Set | |||
|
Precipitation Thresholds
|
Number of Days
|
Normal
|
|
| May 2025 Days with Measurable (>= 0.01 inch) Precipitation |
9
|
10.7
|
|
| May 2025 Days with >= 0.10 inch Precipitation |
7
|
6.5
|
|
| May 2025 Days with >= 0.25 inch Precipitation |
6
|
4.4
|
|
| May 2025 Days with >= 0.50 inch Precipitation |
3
|
2.2
|
|
| May 2025 Days with >= 1.00 inch Precipitation |
1
|
0.7
|
|
|
|
Complete list of Saint Cloud May Records Link to 10 Wettest/Driest Mays |
||
|
Snowfall (in)
|
May 2025
|
Normal
|
|
|
May 2025 Snowfall (in)
|
None
|
0.1
|
|
|
Seasonal Snowfall (in) for Cold Season 2024-2025
|
34.4
|
47.9
|
|
|
Temperatures (°F)
|
Spring 2025
|
Normal
|
| Average High Temperature (°F) |
58.3
|
53.5
|
| Average Low Temperature (°F) |
34.5
|
32.3
|
| Mean Temperature for Spring (°F) |
46.4 (13th warmest spring on record)
|
42.9
|
|
Temperature Thresholds
|
Number of Days
|
Normal
|
| Spring 2025 Days with High Temperatures => 90°F |
1
|
0.6
|
| Spring 2025 Days with High Temperatures <= 32°F |
2
|
11.0
|
| Spring 2025 Days with Low Temperatures >= 70°F |
0
|
0.03
|
| Spring 2025 Days with Low Temperatures <= 32°F |
44
|
46.5
|
| Spring 2025 Days with Low Temperatures <= 0°F |
0
|
3.6
|
| Spring 2025 Days with Low Temperatures <= -20°F |
0
|
0.1
|
| Spring 2025 Days with Low Temperatures <= -30°F |
0
|
0.6
|
|
Liquid Equivalent Precipitation (in)
|
Spring 2025
|
Normal
|
|
Spring Melted Precipitation (in)
|
8.18
|
7.84
|
|
Precipitation Thresholds
|
Number of Days
|
Normal
|
| Spring 2025 Days with Measurable (>= 0.01 inch) Precipitation |
28
|
26.2
|
| Spring 2025 Days with >= 0.10 inch Precipitation |
18
|
14.7
|
| Spring 2025 Days with >= 0.25 inch Precipitation |
13
|
9.3
|
| Spring 2025 Days with >= 0.50 inch Precipitation |
6
|
4.4
|
| Spring 2025 Days with >= 1.00 inch Precipitation |
1
|
0.7
|
|
Snowfall (in)
|
Spring 2025
|
Normal
|
|
Spring 2025 Snowfall (in)
|
7.6
|
13.0
|
|
Seasonal Snowfall (in) for Cold Season 2024-2025
|
34.4
|
47.9
|
|
|
||


Send comments to: raweisman@stcloudstate.edu