March 2024 Saint Cloud Weather Summary
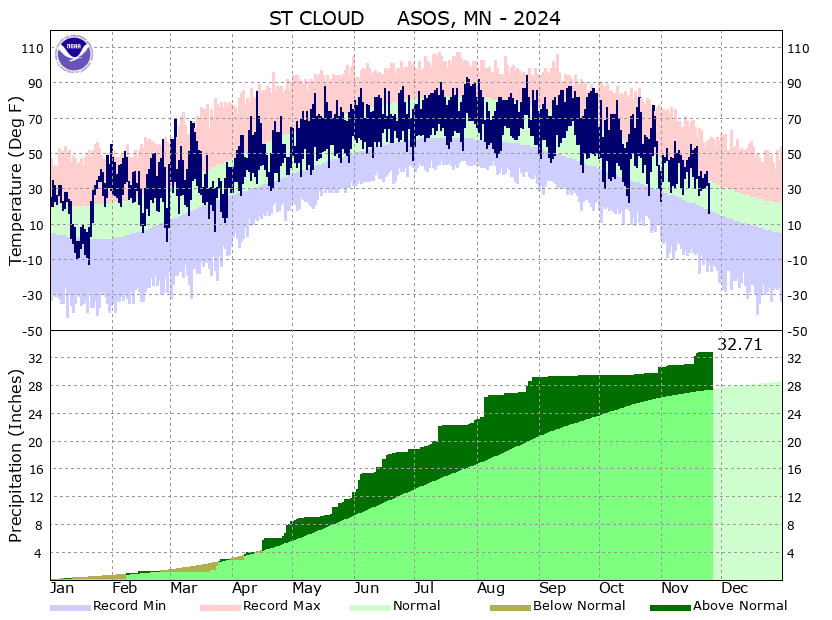
| Year-to-Date Graph | Return to Daily Statistics by Month Table |
2024 March St. Cloud, MN Weather Summary
8th Snowiest March
After spending most of meteorological winter having the conditions of mid-March to mid-April, central Minnesota was hit by a pair of snowstorms that dumped more snow in many parts of Minnesota than the total from October through the first half of March. The two storms produced 18.2 of the 18.3 inches recorded in March at St. Cloud State University, making March 2024 St. Cloud's 8th snowiest March on record. The average March snowfall is 8.2 inches.
During an El Nino year, when there are usually multiple storm tracks across North America, the pair of storms reflected the main possibilities for Minnesota to get major snowfall. The March 21-22 storm produced 5.3 inches of fluff at SCSU and more than 8 inches in a narrow band from just south of St. Cloud into east central Minnesota. That one occurred as a strong storm in the northern branch of the steering winds tracked through Nebraska and Iowa with enough mid-level moisture to squeeze out a third of an inch of water and had enough cold air in place to keep the precipitation all snow.
The second major storm on March 23-26 produced a merger between a major storm in the southern branch of the steering winds and a northern branch system, causing it to track slowly from eastern South Dakota through Iowa and Wisconsin over a three-day period. While there was enough warm air involved to push temperatures above freezing in the southern two-thirds of Minnesota, the large amount of moisture available and the initial cold air allowed the northern two-thirds of Minnesota to see at least 8-12 inches of snow. While there were more than 20 inches total to the west of Brainerd and from the Duluth area along the North Shore, St. Cloud State University picked up 12.9 inches, the 19th heaviest single storm snowfall in St. Cloud (there have been only 25 storms producing a foot or more of snow in St. Cloud records).
The total 2023-2024 snowfall is now 31.9 inches, still 11.2 inches below the average through March. However, the total St. Cloud snowfall before the late March storm pair was only 13.7 inches, which would have been the 2nd lowest St. Cloud seasonal snowfall if it held up through April. So, the only back-to-back cold seasons that appear both in the snowiest top 10 and the least snowy top 10 are 1967-1968 (16.1 inches, 3rd lowest) and 1968-1969 (66.9 inches, tied for 10th snowiest). There have only been 21 days with measurable snowfall so far this cold season, the 19th lowest total in St. Cloud records.
The presence of a snow cover put a chill on the generally mild temperatures experienced during this cold season. After having only 12 of the 91 days from December through February being colder than average, 12 of March's last 15 days were colder than average. However, the strong sunshine this late in the cold season ensured that only one day had a low in the plus single digits and one day had a high in the 20's. The snow pack, which was 8 inches at its highest, helped to keep temperatures down by reflecting much of the incoming sunshine back to space and causing some of the sun's warmth to be used up melting the snow.
Warmest Nov-March on Record
Before the cold came in, March was running at a similar warm pace to earlier winter months (10-15 degrees warmer than average). March temperatures had two major heat surges during the first half of the month: a record-breaking first three days, including a 70-degree high on March 30, St. Cloud's earliest 70 degree high on record, and another very warm period around March 10-12, including a 68-degree high. That pushed the number of record warm temperatures broken or tied to 28 this cold season (see table below).
| St. Cloud Record Warm Temperatures Cold Season 2023-2024 | |||
| Month | Record High | Record Low | Record Average |
| December 2023 | 2 (2 tied) | 3 | 3 |
| January 2024 | 1 (1 tied) | 3 | 3 |
| February 2024 | 1 | 2 | 1 |
| March 2024 | 3 | 1 | 2 |
| Total | 7 (3 tied) | 9 | 9 |
28 total records set or tied
Overall, St. Cloud's March average temperature was 34.1 degrees, 4.9 degrees warmer than average. This ranks as the 20th warmest March since St. Cloud temperature records began in 1881. Despite the late March cold period, the November through March temperature was 30.3 degrees, beating the previous record (2011-2012) by 0.7 degrees. From the highlights below, note that this winter is on pace for several notable mild marks. This includes having the coldest temperature for this winter (-13 degrees during our mid-January cold outbreak) being the 2nd mildest and tying the fewest days (10) with a low of zero or colder.
- March snow events
- March 21-22: 5.3 inches of fluff
- March 23-26: 12.9 inches, 19th heaviest single storm snowfall in St. Cloud
- 40 days with at least an inch of snow on the ground (5th fewest on record, fewest since 1986-1987)
- 21 consecutive days with at least an inch of snow on the ground (6th shortest streak, average is 84 days)
- Extreme Mild Winter Notables
- Mildest low extreme of entire winter: 2nd on record behind 2001-2002 (-9)
- Least lows of 0°F or colder (tie): 10 days in 2011-2012
- Least lows of 32°F or colder: 143 days in 2015-2016
- Least highs of 32°F or colder:: 49 days in 2011-2012
- March 3 70°F high
- Tied for earliest 60°F high with March 3, 1905
- Earliest 70°F high, beating March 6, 1987
- Wet Cold Season
- 10th wettest Dec-Mar (6.26 inches; record 8.68 inches in 1897-1898)
10th Wettest Dec-March in St. Cloud Records
The two storms produced heavy precipitation in St. Cloud, as noted above. The March total precipitation was 1.72 inch, 0.15 inch above average. That precipitation has been relatively rare since the start of the year (11 days with measurable precipitation), but those few days have produced relative heavy precipitation for the colder months (6 days with at least a quarter-inch). Added to the wettest December on record, St. Cloud's total precipitation since December has been 6.26 inches, the 10th wettest December through March in St. Cloud records. The average for four of the normally driest months is 3.82 inches.
The wet cold season has been unusually helpful to the moisture supply. Usually, the bulk of winter precipitation falls when the ground is frozen. So, snowmelt can help recharge rivers and lakes, but usually melts and runs off before it can seep into the ground. Last year was a rare exception. This cold season, the frequent temperature excursions well above freezing has allowed most of the precipitation to easily seep into the ground. Even our late season snow fell when most of the frost was out of the ground, so it will also aid the ground water supply. This has been important since much of Minnesota was coming off a very dry late spring and summer (compare this week's US Drought Monitor to the start of October).
|
Temperatures (°F)
|
Mar 2024
|
Average
|
|
| Average High Temperature (°F) |
44.9
|
38.5
|
|
| Average Low Temperature (°F) |
23.4
|
19.8
|
|
| Mean Temperature for March (°F) |
34.1
|
29.2
|
|
|
March Extremes
|
Temperature(°F)
|
Date
|
|
| Warmest High Temperature for March 2024 (°F) |
70 (set daily temperature record; earliest 70-degree high)
|
March 3
|
|
| Coldest High Temperature for March 2024 (°F) |
27
|
March 27
|
|
| Warmest Low Temperature for March 2024 (°F) |
36
|
March 13
|
|
| Coldest Low Temperature for March 2024 (°F) |
6 |
March 23
|
|
|
Temperature(°F)
|
Date
|
Old Record
|
|
| Daily Record Warm Low |
34
|
March 3
|
33 in 1983
|
| Daily Record Warm High |
59
|
March 2
|
53 in 1918, 1934
|
|
70
|
March 3
|
61 in 1905
|
|
|
68
|
March 11
|
62 in 2016
|
|
| Daily Record Warm Average |
46
|
March 1
|
43 in 1923
|
|
52
|
March 3
|
46 in 1983
|
|
| Earliest 60°F or Warmer High |
70
|
March 3 (tie)
|
March 3, 1905
|
| Earliest 70°F or Warmer High |
70
|
March 3
|
March 6, 1987
|
|
Temperature Thresholds
|
Number of Days
|
Normal
|
|
| March 2024 Days with High Temperatures <= 32°F |
6
|
10.1
|
|
| Cold Season 2023-2024 Days with High Temperatures <= 32°F | 43 (lowest ever - 49 days in 2011-2012) | 87.7 | |
| March 2024 Days with High Temperatures <= 0°F |
0
|
0.0
|
|
|
Cold-season 2023-2024 Days with High Temperatures <= 0°F |
2 |
4.3
|
|
| March 2024 Days with Low Temperatures <= 32°F |
27
|
28.0
|
|
|
Cold-season 2023-2024 Days with Low Temperatures <= 32°F |
134 (lowest ever - 143 days in 2015-2016) |
155.4
|
|
| March 2024 Days with Low Temperatures <= 0°F |
0
|
3.5
|
|
|
Cold-season 2023-2024 Days with Low Temperatures <= 0°F |
42.7
|
||
| March 2024 Days with Low Temperatures <= -20°F |
0
|
0.0
|
|
|
Cold-season 2023-2024 Days with Low Temperatures <= -20°F |
0
|
5.4
|
|
| St. Cloud Historic -20°F Lows | Link to 10 Warmest/Coldest Marches | ||
|
Liquid Equivalent Precipitation (in)
|
March 2024
|
Normal
|
|
|
March 2024 Melted Precipitation (in)
|
1.72
|
1.57
|
|
|
March Extremes
|
Precipitation (in)
|
Date
|
|
|
Most Daily Precipitation in March 2024
|
0.60 inch
|
March 25
|
|
| Daily Precipitation Records |
Amount (inches)
|
Date
|
Old Record
|
| No records set | |||
|
Precipitation Thresholds
|
Number of Days
|
Normal
|
|
| March 2024 Days with Measurable (>= 0.01 inch) Precipitation |
5
|
7.1
|
|
| March 2024 Days with >= 0.10 inch Precipitation |
4
|
3.3
|
|
| March 2024 Days with >= 0.25 inch Precipitation |
4
|
1.8
|
|
| March 2024 Days with >= 0.50 inch Precipitation |
2
|
0.7
|
|
| March 2024 Days with >= 1.00 inch Precipitation |
0
|
0.1
|
|
| Link to 10 Wettest/Driest Marches | Complete list of Saint Cloud March Records | ||
|
Snowfall (in)
|
March 2024
|
Normal
|
|
|
March 2024 Saint Cloud Airport Snowfall (in)
|
18.3 (8th highest)
|
8.2
|
|
|
2023-2024 Seasonal Snowfall (1 Oct 2023 - 31 March 2024)
|
31.9
|
43.1
|
|
| St. Cloud Single Storm Snowfalls | |||
|
Snowfall Thresholds
|
Number of Days
|
Average
|
|
| March 2024 Days with Measurable (>= 0.1 inch) Snowfall |
6
|
5.3
|
|
| 2023-2024 Cold Season Total Days with Measurable (>= 0.1 inch) Snowfall |
|
|
|
| March 2024 Days with >= 1.0 inch Snowfall |
4
|
2.8
|
|
| 2023-2024 Cold Season Total Days with >= 1.0 inch Snowfall |
9
|
14.0.
|
|
| March 2022 Days with >= 2.0 inch Snowfall |
4
|
1.5
|
|
| 2023-2024 Cold Season Total Days with >= 2.0 inch Snowfall |
6
|
7.6
|
|
| March 2024 Days with >= 5.0 inch Snowfall |
1
|
0.1
|
|
| 2023-2024 Cold Season Total Days with >= 5.0 inch Snowfall |
1
|
1.4
|
|
|
March Extremes
|
Snowfall (in)
|
Date
|
|
|
Most Daily Snowfall (in) in March 2024
|
5.1 (set record; see below)
|
March 24
|
|
| Daily Snowfall Records |
Amount (inches)
|
Date
|
Old Record
|
| Daily Maximum Snowfall (inches) |
5.1
|
March 24
|
4.3 in 1996
|
St. Cloud Mildest November-March (avg=19.7)
| Rank |
Winter
|
Average Nov-March Temperature(°F) |
|
1
|
2023-2024
|
30.3
|
|
2
|
2011-2012
|
29.6
|
|
3
|
2015-2016
|
27.8
|
|
4
|
2016-2017
|
26.6
|
|
5
|
2011-2012
|
26.2
|
|
6
|
2001-2002
|
26.1
|
|
7
|
1930-1931 |
25.9
|
|
8 (tie)
|
1881-1882 |
25.6
|
|
8 (tie)
|
1986-1987 |
25.6
|
|
10
|
2005-2006
|
24.7
|
St. Cloud Mildest Extreme Low of the Cold Season
| Rank |
Winter
|
Coldest Low Temperature of Season (°F) |
|
1
|
2001-2002
|
-9
|
|
2
|
2023-2024
|
-13
|
|
3
|
1982-1983
|
-16
|
|
4 (tie)
|
2005-2006
|
-17
|
|
4 (tie)
|
2011-2012
|
-17
|
|
6 (tie)
|
1900-1901
|
-18
|
|
6 (tie)
|
2012-2013 |
-18
|
|
6 (tie)
|
2015-2016 |
-18
|
|
9
|
1897-1898
|
-19
|
|
10 (tie)
|
1956-1957
|
-20
|
|
10 (tie)
|
1986-1987
|
-20
|
Last Updated: April 3, 2024
Send comments to: Bob Weisman


Send comments to: raweisman@stcloudstate.edu